Key facts:
- The worlds population is approx. 7.5 billion people.
- China has the largest population at 1.4 billion, closely filled by India.
- The last decade has seen more young people in the world than ever before, creating unprecedented potential for economic and social progress.
- Women in sub-Saharan Africa are as likely to die in pregnancy or childbirth as women in nineteenth-century England, when Charles Dickens described these horrors in Oliver Twist and A Christmas Carol.
- By the end of the century, the world’s population might be as high as 17 billion or as low as 7 billion, according to the most recent UN estimates.
- HIV-related deaths are down 35 per cent from 2005 – but estimates suggest that deaths among adolescents are actually rising.
- There are more people migrating than ever before. In 2013, some 232 million people were international migrants, up from 175 million in 2000. (Source UNFPA)
1. Population growth.
Definitions you need to know:
Birth Rate: the number of babies being born per 1000 people per year.
Death Rate: the number of deaths per 1000 per year.
Natural Change: the difference between the birth rate and the death rate, given as a percentage.
Natural Increase: the birth rate is greater than the death rate.
Life Expectancy: the average number of years a person is expected to live, taken from birth.
Infant Mortality Rate: the number of babies who die before the age of 1 per 1000 per year.
Child Mortality Rate: the number of children who die before their 5th birthday per 1000 per year.
J Curve: A graph which shows slow growth, followed by exponential growth. (LIC's like The Gambia are seeing this kind of growth)
S Curve: A graph which shows slow growth, exponential growth, then zero growth. (HIC's like Germany are experiencing this kind of growth)
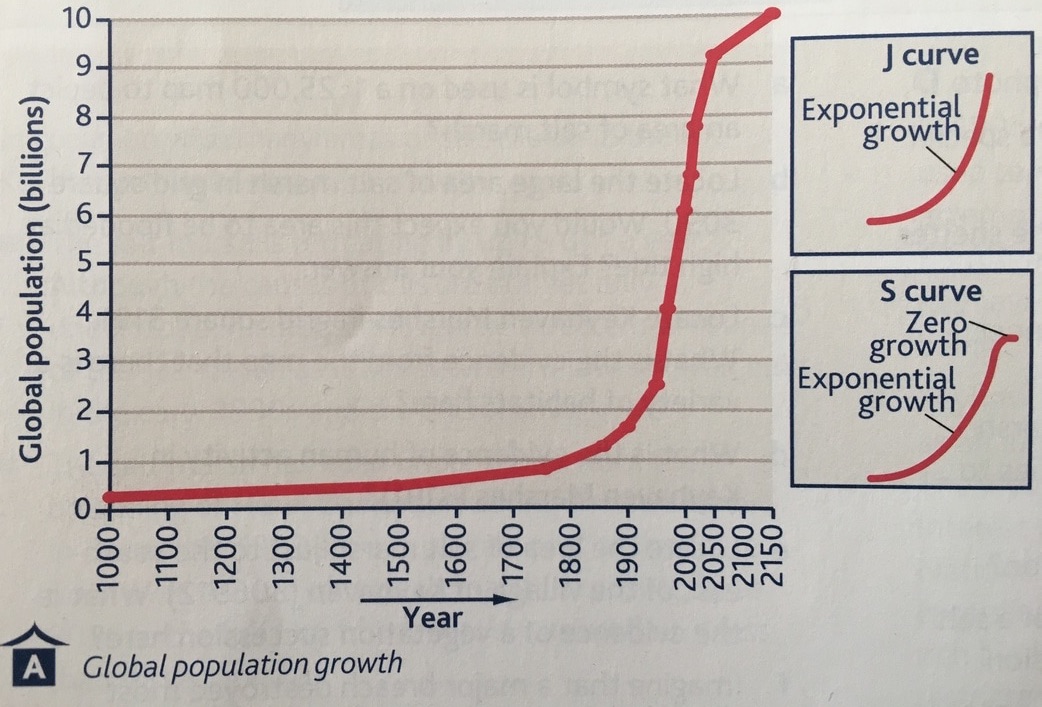 The J curve graph representing Global Population Growth.
A bit of Maths.
To work out the natural change, do the following:
UK:
BR- 10.7 per 1000/yr
DR- 10.1 per 1000/yr
NI- 10.7-10.1
= 0.6
It is expressed as a percentage, so divide by 10= NI- 0.06% per year.
To work out the natural change, do the following:
UK:
BR- 10.7 per 1000/yr
DR- 10.1 per 1000/yr
NI- 10.7-10.1
= 0.6
It is expressed as a percentage, so divide by 10= NI- 0.06% per year.
- Until the 1800's the worlds population grew slowly for thousands of years.
- In 1820, the worlds population reached a billion.
- In the early 1970's, the worlds population reached 3 billion.
- In 1999, less than 30 years later the population doubled to six billion.
- The global rate of growth is one billion every 15 years!!! (Source: BBC Bitesize App)

What factors affect birth rates and death rates?
High BR in LIC's:
What factors affect population growth?
High BR in LIC's:
- Poor access to birth control- fewer medical centres, distance to medical care, cultural or religious views, cost, lack of education,
- High infant mortality rates- couples have larger families owing to the knowledge that some may die, maternal health care is poor, many mothers die in childbirth, post childbirth education is poor.
- Low mechanisation- in rural areas, families rely on children to work in subsistence farming owing to a lack of machinery.
- Improved sanitation- sewers or piped water being implemented, stand pipes and boreholes.
- Better food production and availability- more reliable nutrition, varied diets.
- Improved medical care- vaccination programmes, greater access to doctors leading to more people surviving beyond 15.
What factors affect population growth?
- Agricultural Change- as technology improves, less people are needed to farm the land. This means that people can work in other industries which may pay more money. It also means that families will not need to have as many children to work then land. This means that families are supporting less people and often leads to more children being healthier and going to school.
- Urbanisation- in NIC's and LIC's lots of people migrate from the countryside to the city. This is called Rural to Urban Migration. People make this move (even though they often don't fully understand what will the city will be like) because they are looking for greater work opportunities. Parents also wish their children to access to greater levels of education and job prospects. Highly urbanised societies have lower rates of populations growth, especially in cities.
- Education- as more people are better educated, they have more earning potential. If families have lots of education, fewer can be educated. Many parents see education as the best way to get out of poverty.
- Status of women- opportunities for women improves alongside of men. As larger workforces are required, women must be utilised in order for industry to grow. Over time, less prejudice towards women holding senior positions exists. Equality increases as countries develop- Sweden has even changed its laws so that there are more women in management positions. As women gain carers and hold higher and well paid jobs, they are less likely to leave work and have lots of children. However, childcare in many HIC's is expensive and this can discourage women from working.
Exam practice.
Now practise what you have learnt by having a go at the exam question below. This was set by AQA in 2013.

2. The Demographic Transition Model.
What is the Demographic Transition Model?
- The Demographic Transition Model (DTM) demonstrates the stages of development a country goes through.
- It explains birth and death rate models around the world over time.
- It shows the links between population and economic changes.
- It is divided into 5 stages. Stage 1 has high birth and death rates, and a lower overall population. By Stage 5, the population has peaked and is starting to decline.
- It has strengths and weaknesses as a model. Can you think what these might be? An example of its strength is that it allows us to make comparisons between countries and think about where a country development might go in the future. However, it is also designed by countries that are already economically developed. Should we assume that all countries should and will develop in the same way?
- See the diagram below for detail on each stage. You can also find a good diagram with clear information in the textbook page 173.
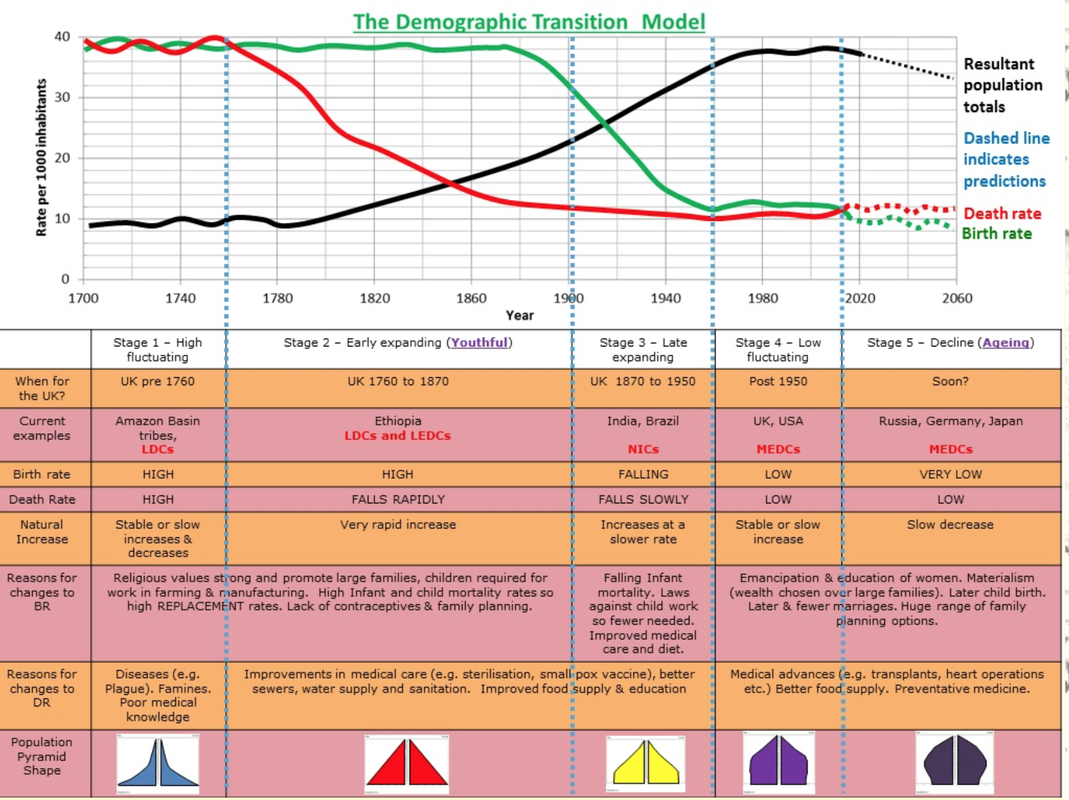
Source: www.coolgeography.co.uk
3. Population Pyramids.
What is a population pyramid?
- A bar graph which divides up the population of a country by age, and gender.
- Sometimes they are called an age-gender structure because of this.
- Age structure: the proportion of each age group in a population which links closely to the stage of development.
- Gender structure: the balance between males and females in a population. Tiny differences can tell you a lot about a country.
- The base of the pyramid shows you the birth rate of a country. If it's wide, it has a high birth rate.
- The top of the pyramid shows you the life expectancy. If there is a wider peak, at a high age, it shows you people are living longer.
- The sides of the pyramid show you the death rate. If there is a big bar in the 0-5 age, but the bars shrink a lot after this, it probably means that there is a high infant mortality rate.

Source: BBC Bitesize
Notice the difference between the two pyramids. Mozambiques is a classic pyramid shape which means that it has a high birth rate, lower life expectancy and a higher death rate. We can see that there are lots of people. Mozambique has a youthful population.
|

The UK's pyramid is very different to Mozambiques. It has a thicker trunk, with a lower birth rate and a lot of people living to an older age. It has a lower death rate and a lower birth rate. We can see that the Infant Mortality Rate is lower too because the 5-9 bar hasn't shrunk from the 0-4 age range. In fact, the 0-4 section is smaller, demonstrating the birth rate is going down. The UK has an ageing population.
|
The population is going to continue to change and so the population of individual countries will evolve. The pyramids, therefore will also evolve. You should think of them in this way- every 5-10 years, a person moves up the graph. In the future, some countries population will stabilise and potentially decline. In India the birth rate will stabilise by 2025, and by 2050 will begin to decline. And more people will live into old age, India will move towards Stage 4 of the DTM.
Exam practice.

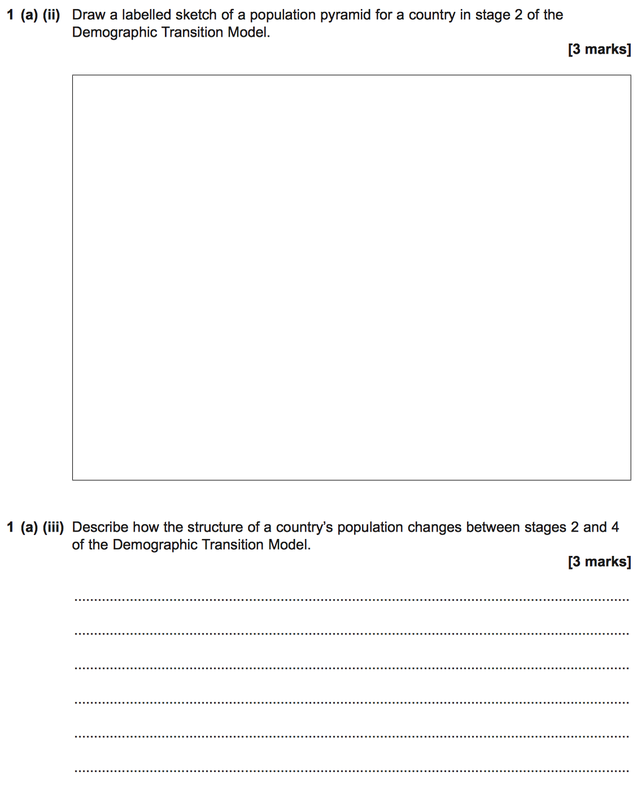
Exam Tips and notes from the mark scheme:
- You don't need to draw every bar on the pyramid, just the axis and the outline.
- It says to label the pyramid. Reasonable responses include:
- comments on birth rate/death rate etc. E.g. wide base; narrow top; few elderly people; steep sides; concave sides; high birth rate; low life expectancy.
- If you have an incorrect sketch / no sketch but 2 labels correct for stage 2 diagram = max 2 marks.
- comments on birth rate/death rate etc. E.g. wide base; narrow top; few elderly people; steep sides; concave sides; high birth rate; low life expectancy.
- Answers need to relate to structure of population and change. A number of possible elements may be referred to such as: fewer children / young dependants; increasing proportion of the population of working age; greater number surviving to old age / more elderly dependants. Credit elaboration of any change such as describing the transitory stage 3 elements between stages 2 and 4.
- Be careful to make sure that you comment on the population rather than the key terms.
4. How can a population become sustainable?
Countries who are struggling to balance out their populations need to try to get to a point where their birth rates and death rates stabilise. India and China both have populations over 1 billion. This puts a lot of pressure on their economy, government, services, and resources. Because of this China's Government imposed the One Child Policy. It is an example of a population control policy.
The One Child Policy
- Before 1979, the country had been griped by a catastrophic famine between 1959 and 1961, and after that a "baby boom" which caused the population to grow at an unsustainable rate.
- The Government were trying to act quickly to prevent future crisis. However, their methods were largely considered to be harsh and often cruel.
- The main aims of the policy were to slow down population growth and reduce the impact on resources.
- The policy was very controversial because of the ways it was enforced.
- Couples were limited to one baby- regardless of gender.
- To enforce he rules of the One Child Policy, the government encouraged certain benefits and fines to those adhering or not adhering to the policy
- Coupl
